5 Underused Google Data Studio Tools
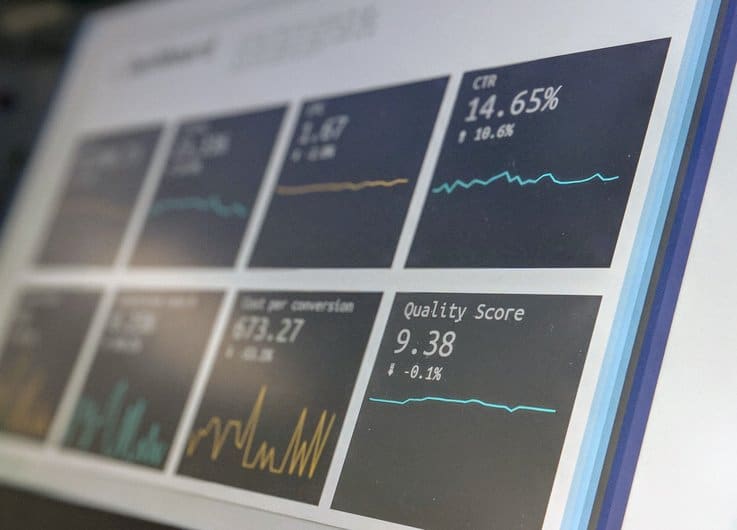
One of the biggest strengths in digital marketing is being able to measure campaign performance- live-monitoring the results of our digital efforts daily, and tracking the evolution of performance over time. There are numerous report creation platforms which can help with this. The Google Marketing suite offers, for free, a tool which allows you to create personalized reports with multi-source data (Analytics, Google Ads, YouTube, Facebook, etc.). Google Data Studio will quickly become your closest ally, as it allows you to:
- Create dashboards which highlight important and relevant data for clients and marketing specialists (on-site buying journey, creative or campaign performance, demographics of specific users etc.)
- See an overview of campaign results by grouping them all in one place rather than on multiple different platforms
- Monitor performance in real time, and compare specific time periods
- Amalgamate results from different platforms for a more in-depth analysis
At first glance, the platform could seem complex or even intimidating, so we’ve compiled a list of the 5 most underused tools which will help you to effectively build your next report.
1. Report Templates and Duplication
The most time consuming aspect of using Data Studio is starting your report from scratch. With a blank page before you, it can quickly become daunting. We waste so much time, thinking about how best to present our data- starting over and over again because we’re not happy and then, 5 hours later, our report is still unfinished. Fortunately, the platform offers templates tailored to your needs. All you need to do is to change the data source, make sure the metrics are correct, adjust the layout and Bob’s your uncle!

Another function which is often overlooked is report duplication. This tool allows you to duplicate a report which you like and which meets your needs, meaning you don’t need to start from scratch, as the tables are ready built according to the data which is to be presented.
2. Heatmaps
This function allows you to present your data in an easy-to-digest manner by coloring the cells of the spreadsheet depending upon their value. The higher the value, the darker the color, helping to draw the eye to the most important areas. To achieve this, select a table and then go to the ‘style’ tab on the right. From here, choose the column you wish to highlight and select ‘heatmap.’

3. Pivot Tables
Pivot tables allow you to group a variety of metrics in one single table. By doing this we can then filter the data by two related metrics, age then gender for example, or campaigns, adsets, then ads, in order to see the results more clearly.

To do this, simply activate the ‘expand/ collapse’ functions below your metrics.

4. Merging Data Tables (Scorecards)
In certain reports, you’ll need to merge data derived from two different platforms. For example, calculating the ROI of the Google Ads cost by the revenue of transactions, in Analytics. One simple, if time-consuming way to do this, is to extract the data into Google Sheets and then match-up the figures. A quicker alternative is to merge your data tables (scorecards) in one swift click in Data Studio. This allows you to save time, and is carried out directly in the report. To do this, select the two data tables that you wish to merge, right click, and then select ‘combine the data’. Now you can dig down into your stats and play around with the relation between your data sets (adding, subtracting, diving, calculating percentages, etc.)

5. ‘Contains’ Formulas
‘Contains’ Formulas are not very well known but they are very useful. These formulas allow us, primarily, to group different data formats together- creatives, campaigns, etc. They are used to quickly filter information. For example, if in one single Facebook campaign, you have a variety of different creatives in different formats (videos, stories) the ‘contains’ formula will allow you to group them all together.

A final Word
There are many other functions which may prove useful in saving you time and helping to simplify how you digest your data. Our final recommendation is the ‘share’ function. Once your report is finished, Data Studio offers you the possibility to share a visual version to your partners, clients or colleagues. This allows your team to see and monitor all the information they need even when working remotely, in one single constantly updated document.
By Florence Loranger

Determined to uncover all the secrets of marketing, Florence studied her baccalaureat in communication science at the University of Montreal. Her passion for the internet was born during her uni days when she took part in the Communication Games. It’s difficult not to be influenced by Florence’s warmth and smile even from the other side of a screen.